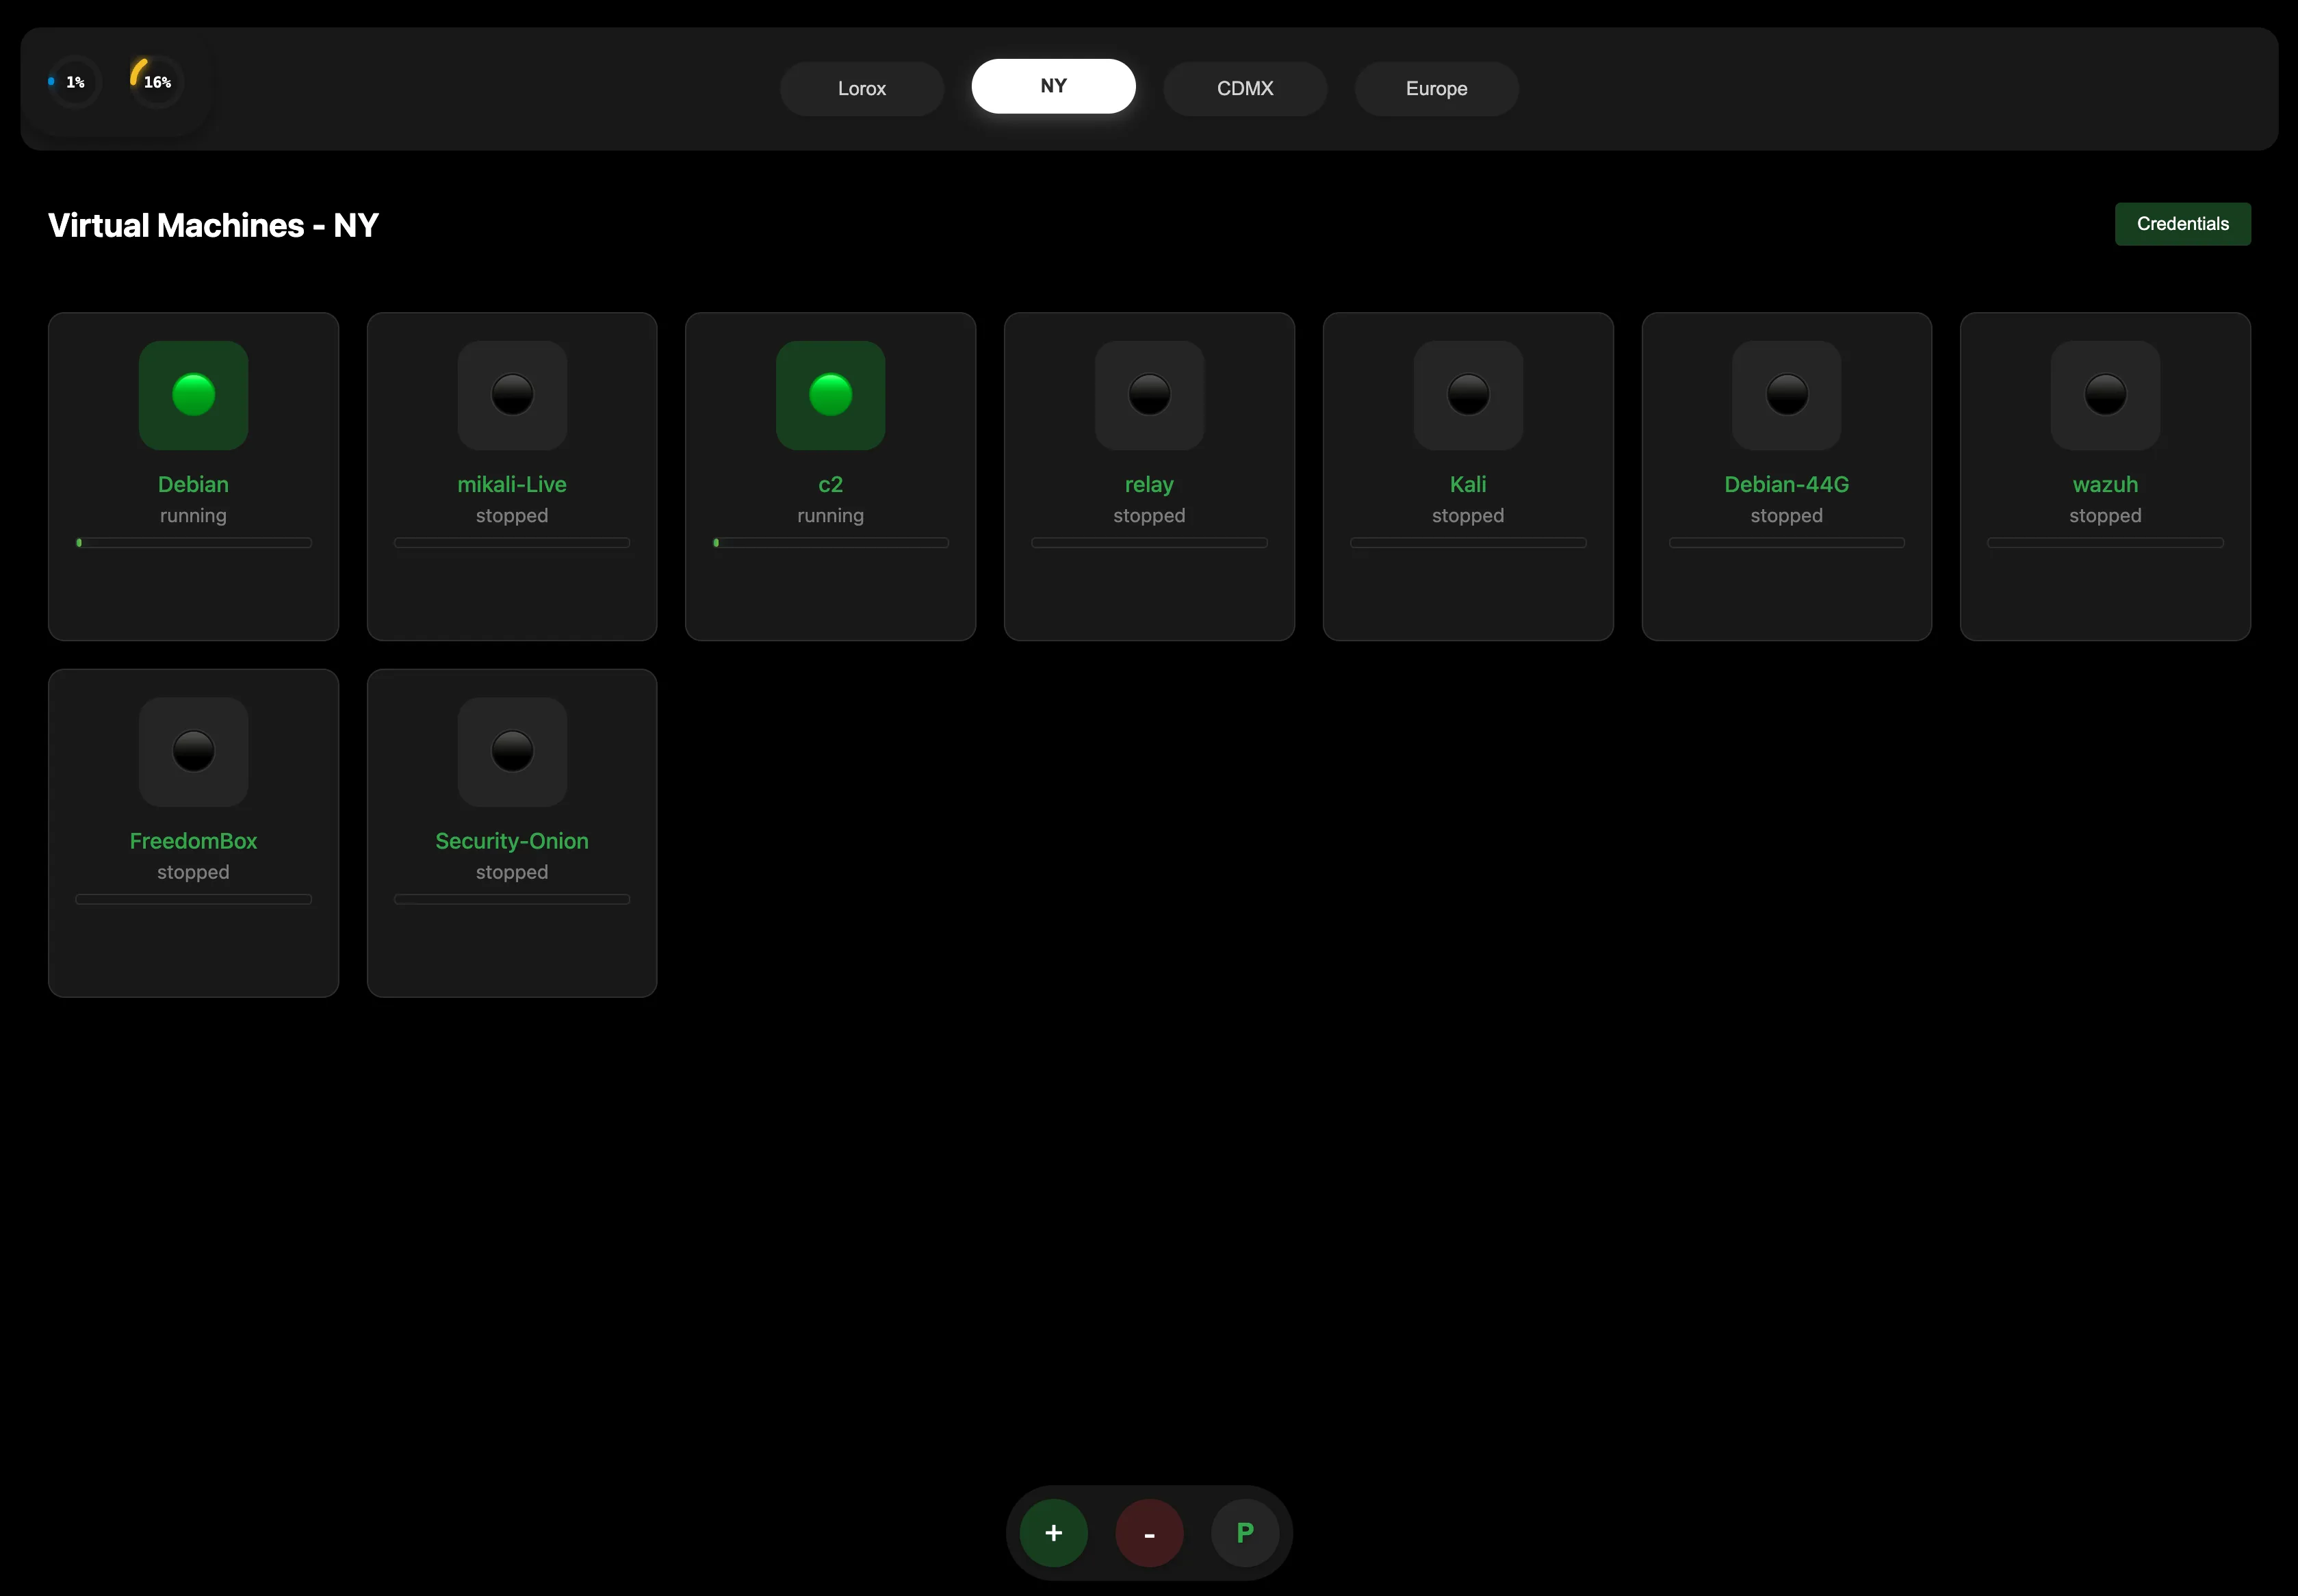
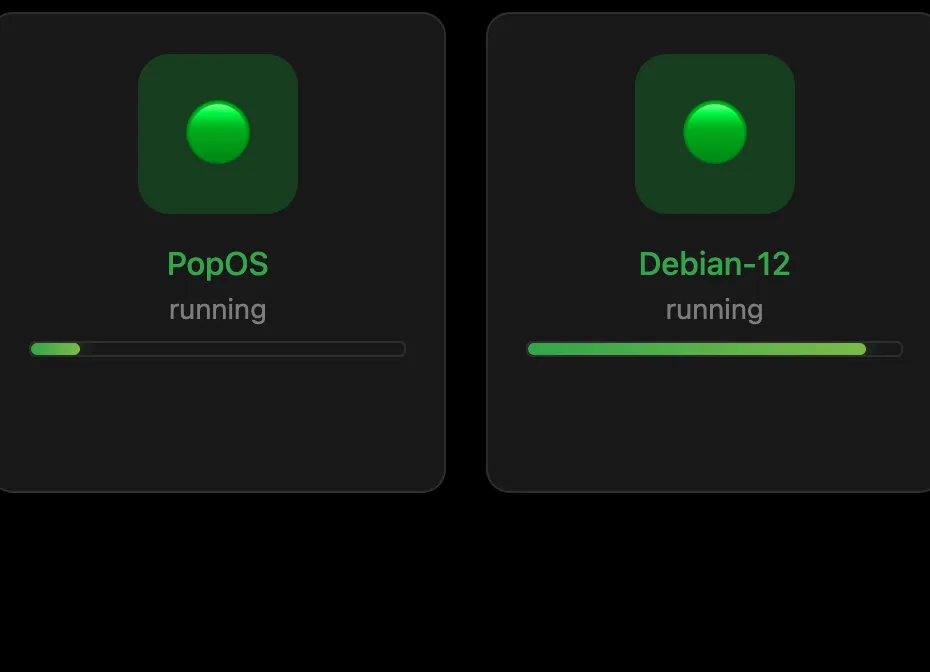
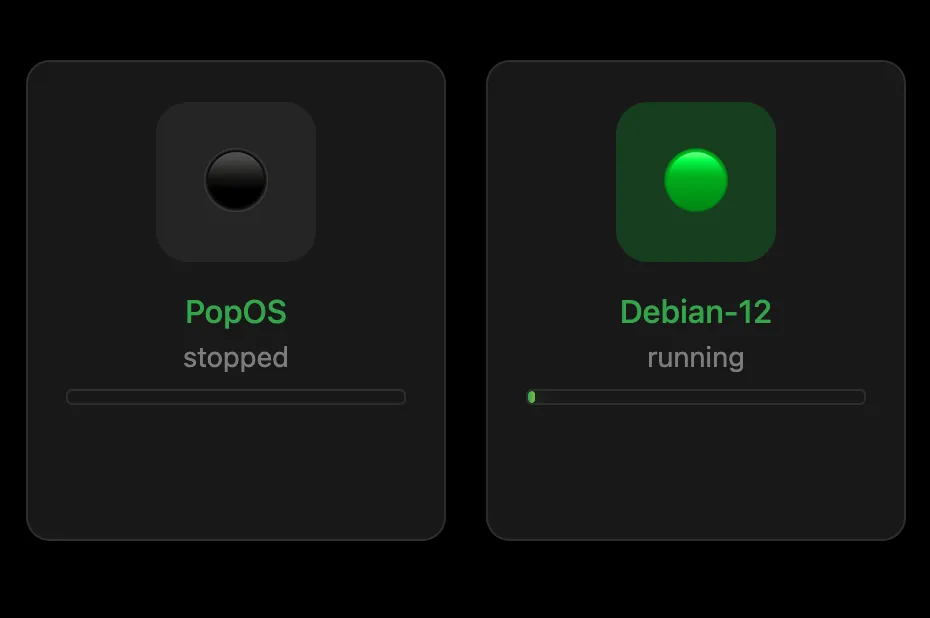
Running, stopped, and availability cues stay obvious on dark surfaces.
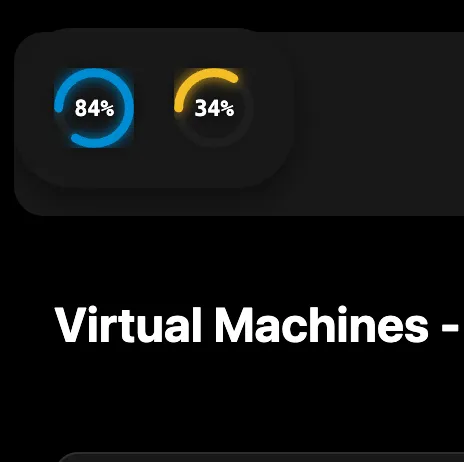
Blue-first, operator-friendly
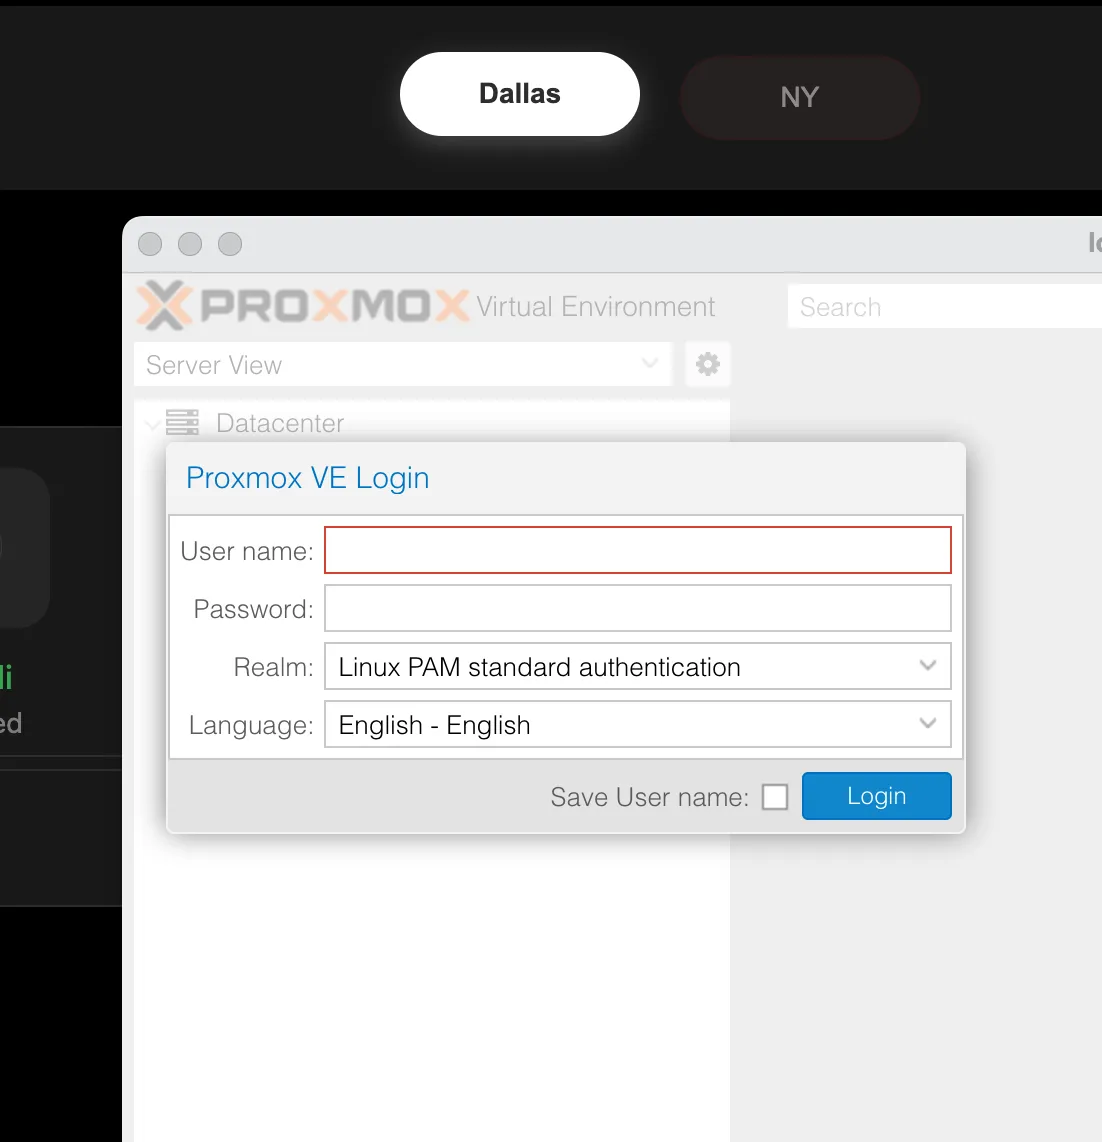
A calmer control layer for your Proxmox servers.
Proxnex now speaks the same visual language as the icon and the app itself: deep navy structure, clear blue hierarchy, and sharp orange accents exactly where actions matter.
Live status at a glance
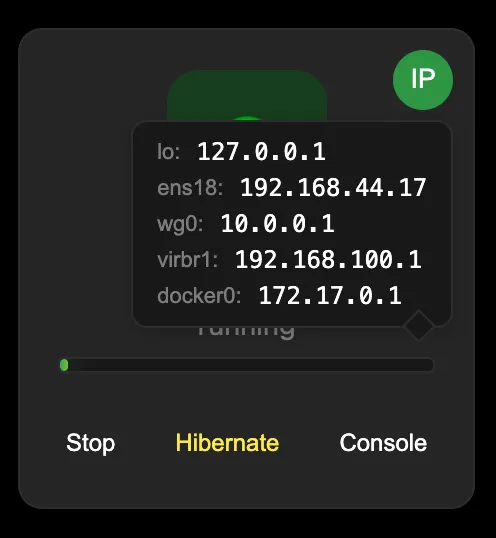
Start · Stop · Hibernate · Console
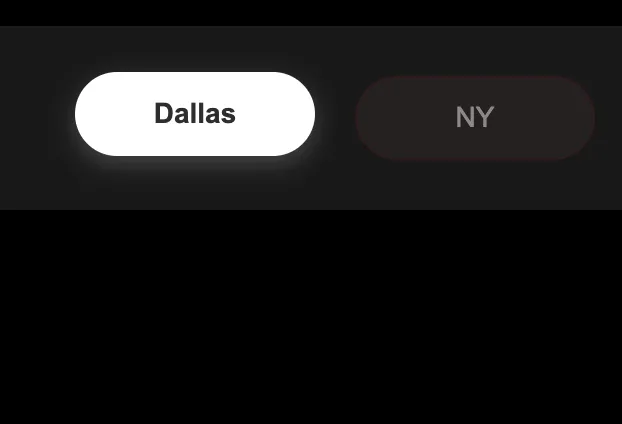
Instant IP visibility
Power flow
Start · Stop · Hibernate
Visibility
Nodes, VMs, IPs, and resource state